
EV/Sales vs P/S: Why I Changed How I Value Small-Caps

When I started investing I didn’t understand much about company valuation, and as I spent more time in the game, I have learned some techniques to properly evaluate companies’ fundamentals. Price-to-Sale (P/S) is a very commonly used metric to quickly determine if a stock is cheap or not, particularly for small cap stocks/ pre-revenue companies. However, P/S ignores what is happening below the market cap line, and for small-caps, that’s often where the most important information lives.
What P/S actually measures
P/S divides a company’s market cap by its trailing twelve-month (TTM) revenue. For example, if a company has a $500 million market cap and generates $100 million in annual revenue, its P/S is 5x.
What P/S captures is how much investors are paying per dollar of sales for the equity portion of the business. What it ignores is the company’s debt and cash position, which means two companies with identical market caps and revenues can have the same P/S ratio despite having fundamentally different financial situations. One might be sitting on $200 million in cash with minimal debt. The other might be carrying $500 million in debt with almost no cash. The companies may have the P/S, but show two completely different risk profiles and actual values.
For large-caps, this limitation matters less. Most mature companies have relatively standardized capital structures, and analysts adjust for debt anyway. But small-caps are different. You see companies fresh off IPOs sitting on piles of cash they haven’t deployed yet. You see legacy industrials weighed down by debt from acquisitions that didn’t pan out. You see growth companies that have borrowed aggressively to fund expansion. The variation is enormous, and P/S treats all of them the same.
What EV/Sales captures that P/S misses
Enterprise value (EV) takes market cap and adjusts for capital structure, i.e., adding total debt and subtracting cash. This is because if you were to acquire a company outright (the entire business), you wouldn’t just pay the market cap. You’d also inherit its debt obligations, which you will eventually need to pay off, as well as its cash, which you could pocket.
The EV/Sales metrics answers a different question than P/S. Instead of asking “what are investors paying for each dollar of revenue through the equity?”, it asks “what would you pay for each dollar of revenue if you bought the whole thing?” For comparing companies with different capital structures, this is a much more useful question.
The distinction becomes most important for companies with significant net debt or net cash positions, which describes a large portion of the small-cap universe. Growth companies burning through cash, industrial companies with legacy debt, recent IPOs with undeployed capital, while representing different valuation scenarios, can theoretically show similar P/S values, but for the ‘wrong’ or ‘uncomparable’ reasons.

Let me show you what I mean with an example of two structurally different companies.
SoundHound AI is a voice AI company with a market cap of around $4.66 billion and TTM revenue of $148.4 million. On P/S, that’s roughly 31x. Plug Power is a hydrogen fuel cell company with a market cap of about $3.2 billion and revenue of $676 million. On P/S, that’s around 4.7x.
If you stopped there, Plug Power looks dramatically cheaper. You’re paying $4 for every dollar of revenue versus $30 for SoundHound. A pure P/S screen would rank Plug as the obvious bargain, nearly 7 times cheaper.
But look at the balance sheets. SoundHound has $269 million in cash and just $5 million in debt, giving it a net cash position of roughly $264 million. Plug Power has $166 million in cash but $991 million in debt, leaving it with net debt of $825 million.
When you calculate EV, the gap narrows significantly. SoundHound’s EV is $4.54 billion (market cap minus net cash), while Plug’s EV is $4.025 billion (market cap plus net debt). Now, if you look at the EV/Sales calculation, you can see that SoundHound trades at 29x EV/Sales, while Plug trades at 6x
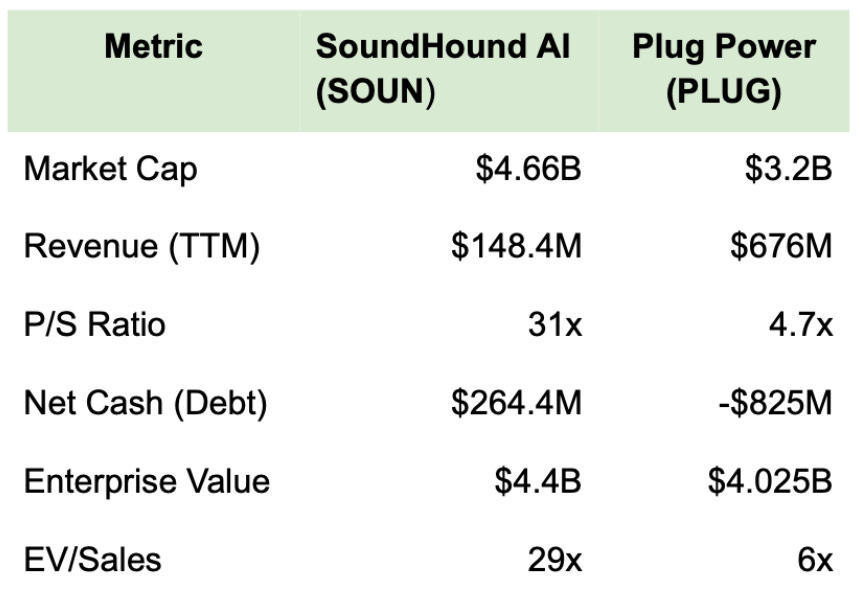
On P/S, SoundHound looks 6.6 times more expensive than Plug Power. On EV/Sales, SoundHound is about 5 times more expensive. The gap shrinks by nearly 30% once you account for capital structure, and that 30% difference matters. When you’re building a portfolio and trying to figure out where to allocate capital, thinking Plug is 6.6x cheaper than it actually is (relative to SoundHound) can lead to meaningful misallocation. Plug Power’s “cheap” P/S ratio partly reflected its debt burden being ignored by the calculation, not genuine undervaluation.
For an even more extreme example, consider Sabre, a travel technology company trading at just 0.16x P/S. Looks like a screaming bargain until you realize it carries $5 billion in debt against an $836 million market cap. Its EV/Sales is actually 1.34x, which is still cheap but tells a completely different story.
Using EV/Sales to think about future prices
Here’s where EV/Sales becomes genuinely useful beyond just comparing companies. This ratio helps you think about what needs to happen for a stock price to reach a certain level.
If you can estimate a company’s future EV (by projecting revenue and assuming an EV/Sales multiple), you can back into what the market cap, and therefore stock price, would need to be.
Take a debt-heavy company like Plug Power. If Plug Power grows revenue to $1 billion and the market values it at 5x EV/Sales, that implies an enterprise value of $5 billion. If Plug also pays down $300 million in debt during that period (reducing net debt from $825 million to $525 million), the market cap would be $5 billion minus $525 million, or $4.5 billion. That’s a 67% increase from today’s $3.2 billion market cap, even though EV only grew 43%.
This is the leverage effect of debt paydown. As a company reduces debt, EV gets allocated more to equity holders and less to creditors. Shareholders benefit disproportionately from operational improvement.
The inverse applies to cash-rich companies. If SoundHound deploys its $264 million cash pile on acquisitions that don’t immediately generate revenue, the market cap might not grow even if the business is strategically stronger. The cash moved from the balance sheet into assets that take time to monetize. EV/Sales helps you see this dynamic, while P/S obscures it.
This framing also helps with downside scenarios. For highly leveraged small-caps, a revenue decline doesn’t just compress the multiple, it threatens the equity entirely. If Plug’s revenue dropped 30% and EV/Sales stayed at 5x, the enterprise value would fall to $2.4 billion. Subtract the $825 million net debt, and you’re left with $1.6 billion in market cap, a 40% decline from revenue dropping 30%. The debt amplifies equity losses just as it amplifies gains.
However, P/S isn’t useless. For initial screening when I’m trying to narrow many companies down to 10-20, it’s faster to pull and gives me a rough sense of valuation ranges within a sector. If two companies have similar capital structures, P/S and EV/Sales will tell roughly the same story anyway.
My current process uses a hierarchy. P/S for initial filtering when I’m just trying to eliminate obvious outliers. EV/Sales when I’m down to 10-20 candidates and actually comparing valuations. Full capital structure analysis, including debt maturity schedules and cash runway, when I’m doing a deep dive on a specific company.
I should also note that EV/Sales has its own limitations. It doesn’t account for profitability or margin structure. A company trading at 2x EV/Sales with 50% gross margins is very different from one at 2x with 20% margins. EV/Sales is better than P/S for adjusting for capital structure, but it’s still just one lens.
How this changed my approach
The practical shift was adding balance sheet data to my screens alongside revenue. Now when I pull small-cap valuations, I’m looking at cash and debt positions before drawing any conclusions about relative value.
This matters more than it might seem. Small-caps with significant net cash positions often look expensive on P/S because the cash is inflating market cap without contributing to revenue. But that cash represents real value, either as a runway for growth investments or as a margin of safety if things go wrong. Screening them out because of high P/S ratios means missing companies that might actually be reasonably valued once you account for their balance sheets.
The opposite is also true. Small-caps trading at low P/S multiples sometimes look cheap because the market is pricing in the risk of their debt loads. That debt represents a claim on future cash flows that comes before equity holders. If you ignore it, you’re not seeing the full picture.
I use EV/Sales throughout my deep dives, and I’d encourage anyone building screens for small-caps to do the same. The extra step of pulling balance sheet data is laborious, but it’s the difference between comparing actual valuations and comparing illusions.
Disclaimer
This newsletter is for educational and informational purposes only. Nothing I write constitutes financial advice, investment recommendations, or a solicitation to buy or sell any securities. You should not make investment decisions based solely on my analysis. Always do your own due diligence, consult with qualified financial advisors, and consider your individual circumstances before making any investment. All analysis and opinions are my own and can be wrong. Markets are uncertain, and even well-researched ideas can lose money. I am not a licensed financial advisor and accept no liability for any losses resulting from the use of information in this newsletter.
If this piece helped you, like it, share it, or repost it on Substack, it really helps my work reach more readers like you, and consider subscribing to receive new posts directly to your inbox!