
Serve Robotics (SERV) - Deep Dive

Serve Robotics (SERV) is a company that I have only recently come across. Since the 2nd of January SERV has skyrocketed almost 40%, raising the company’s market cap to $1.09B (at the time of writing). Recent displays at CES have drawn international attention (particularly from retail investors), and I thought this would be a good chance for me to look deeper into the potential for this company.
Within this deep-dive I share the same scoring framework that I use to make investment decisions, and share at the end my opinion on where the company is headed, and whether I consider it a good (early-stage) investment. This is not financial advice.
Introduction
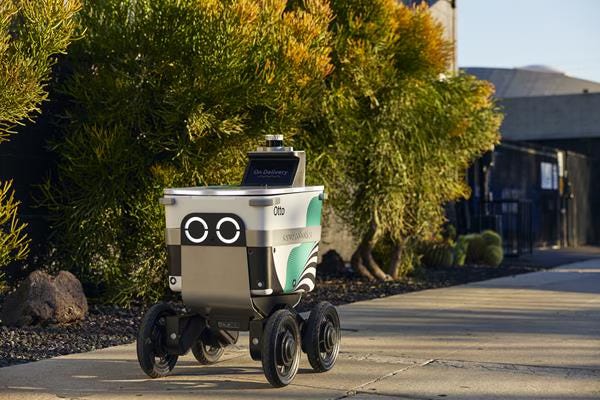
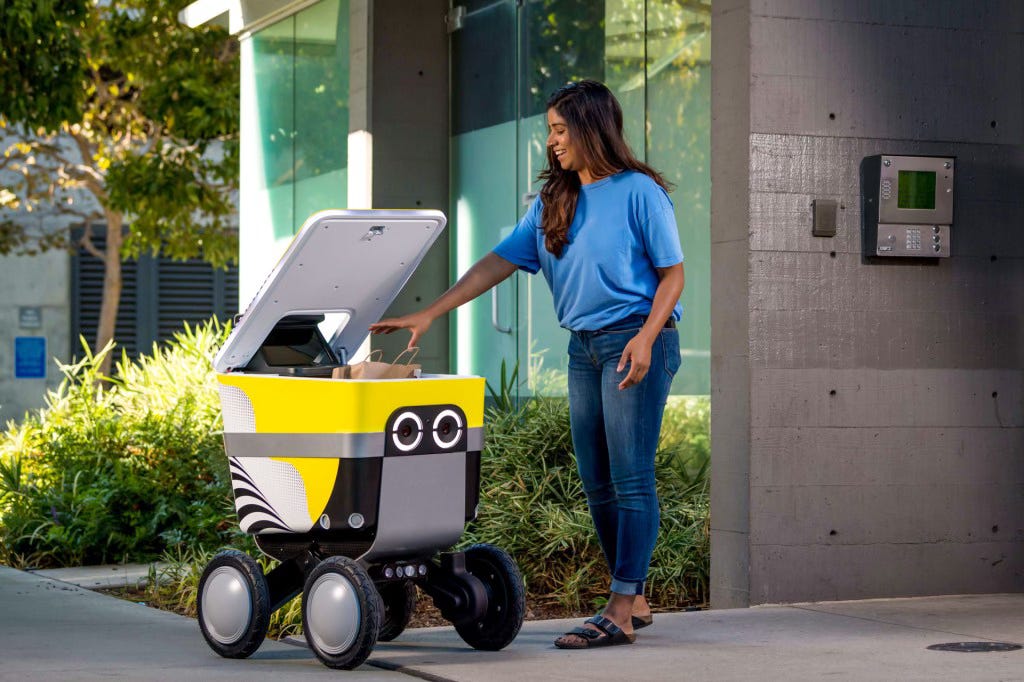
Serve Robotics develops AI-powered sidewalk delivery robots for autonomous last-mile logistics, operating the largest fleet of its kind in the United States. The company generates revenue through Delivery-as-a-Service fees from platform partners (Uber Eats, DoorDash) and software licensing with manufacturers. Over 2,000 third-generation robots serve 320,000+ households across seven metropolitan markets including Los Angeles, Miami, Atlanta, Dallas-Fort Worth, Chicago, Fort Lauderdale, and Alexandria, partnering with 2,500+ merchants. Revenue reached $1.94M trailing twelve months (TTM), with $211M cash providing runway through late 2026. Management projects $60-80 million annualized run rate (ARR) once the fleet reaches target utilization of 15-20 deliveries per robot daily during 2026.
The investment thesis centers on Serve’s positioning across e-commerce expansion, labor cost inflation pressuring delivery economics, and regulatory acceptance of autonomous robots in urban environments. The company executed successfully on operational targets in 2025, quadrupling its fleet while expanding from two to seven metros and launching strategic partnerships with DoorDash and Magna. However, the business model remains unproven at scale. Negative gross margins mean deliveries lose money before operating expenses, operating losses reached $80 million Trailing Twelve Months (TTM) on $1.94M revenue, and Uber plus Magna provide 70% of revenue.
The company’s profitability is contingent on utilization and unit economics yet to be validated.
The trade-off is, as often the case with early-stage companies, growth potential versus execution risk. Bulls see massive market expansion with Serve’s projected run rate representing minimal current penetration. Bears focus on competitive threats from Starship Technologies (direct competitor - 9 million completed deliveries versus Serve’s 100,000), deteriorating margins despite revenue growth, customer concentration creating dependency, and unproven unit economics burning $60 million+ annually. The company trades at 442 EV/Sales, pricing in flawless execution of an unvalidated model.
Recent Developments
Serve Robotics has made several strategic moves in 2025 to support its growth:
DoorDash Partnership (Q3 2025): Multi-year strategic partnership diversifies beyond Uber dependency, providing access to 37 million monthly active users and extensive restaurant network. Financial terms are undisclosed, but this is expected to reduce customer concentration risk and increase order volume.
2,000-Robot Deployment Milestone (December 2025): Completed full deployment on schedule, creating the largest U.S. sidewalk delivery fleet.
Vayu Robotics Acquisition (August 2025): Acquired for 1.7 million shares plus earnout provisions. Brings AI foundation models for end-to-end learned autonomy, targeting $1 per delivery operating cost.
Phantom Auto Acquisition (September 2025): Acquired Voysys ultra-low-latency teleoperation platform, enabling human operators to assist robots in edge cases. Integration supported achievement of 99.8% delivery completion rate.
Capital Raises: $187M raised over 18 months through multiple tranches, diluting share count from 36.5 million to 61.3 million (68% increase).
Geographic Expansion: Launched five new metros in 2025, expanding from 2 to 7+ markets (cities) reaching over 3 million people.
At the same time, the company’s competition has made moves:
Starship-Uber Global Partnership (November 2025): Market leader Starship announced global Uber Eats partnership launching UK (December 2025), expanding Europe (2026), and entering US (2027). This directly threatens Serve’s positioning as Uber’s exclusive U.S. partner and validates multi-vendor strategy potentially commoditizing robot delivery services. Starship operates 2,700+ robots with 9+ million completed deliveries.
Starship Expansion Plans: $50M raise (October 2025) funds expansion from 2,700 to 12,000 robots by 2027, supporting their claimed positive gross margins approaching profitability.
Nuro Strategic Pivot: Competitor Nuro exited sidewalk robot market to focus on autonomy licensing, reducing competitive intensity.
Recent developments reveal aggressive operational execution paired with intensifying competitive and financial pressures. The 2,000-robot deployment demonstrates manufacturing competence and validates technology transfer across diverse urban environments. Expansion to seven markets in a single year shows regulatory approval is manageable. However, the DoorDash partnership timing, coinciding with Starship-Uber announcement, suggests defensive positioning against concentration vulnerability.
Starship’s U.S. entry fundamentally shifts Serve from exclusive partner to one of multiple providers competing on economics. The capital structure suggests continued cash raises are inevitable unless unit economics inflect dramatically in 2026. The Vayu acquisition represents a technology bet that could differentiate if AI models deliver promised costs, though this remains unproven.
Competitive Position
Moat Analysis
1. Platform Partnership Lock-in
Serve’s multi-year commercial agreement with Uber to deploy up to 2,000 robots on Uber Eats provides access to massive delivery infrastructure and merchant base. This creates moderate switching costs as replacing Serve would require sourcing, testing, and integrating alternatives while maintaining service continuity. However, this strength simultaneously represents concentration risk, with Uber and Magna accounting for 70% of Q2 2025 revenue.
Most importantly, the recently announced global partnership between Uber and Starship Technologies directly undermines exclusive positioning. Uber maintains concurrent partnerships with multiple providers (Starship, Cartken, Motional, Serve), pursuing multi-vendor strategy that enables performance comparison, negotiation leverage, and reduced switching costs. This commoditizes robot delivery services and pressures margins as providers compete for positioning within Uber’s network.

2. Data and AI Learning
Serve emphasizes “over eight years of field learning” in Gen 3 robots and claims 99.8% delivery completion rate. The company completed 100,000+ deliveries, generating operational data on sidewalk navigation, weather conditions, and obstacle avoidance. This data theoretically compounds with each delivery, improving route optimization through Vayu AI foundation models.
The fundamental weakness lies in scale disadvantage versus Starship Technologies, which completed over 9 million deliveries traveling 12 million autonomous miles. This 90x delivery advantage translates to vastly superior training data, with Starship’s 200 million road crossing dataset dwarfing Serve’s experience. While Serve’s technology functions effectively, competitors possess equivalent or superior capabilities developed over similar timeframes.
3. Switching Costs for Platform Partners
For Uber, switching away from Serve would involve operational disruption including retraining merchant onboarding, customer expectation management, and logistics coordination. Markets where Serve operates would face service interruptions during provider transition. However, switching costs remain moderate because Uber controls the underlying infrastructure, consumer app, merchant relationships, and demand aggregation, whereas Serve is essentially a fulfillment provider. Uber could deploy alternative providers market-by-market without catastrophic disruption.
Moat Analysis Score: 4/10
Industry Dynamics
1. Growth Rate and Secular Trends
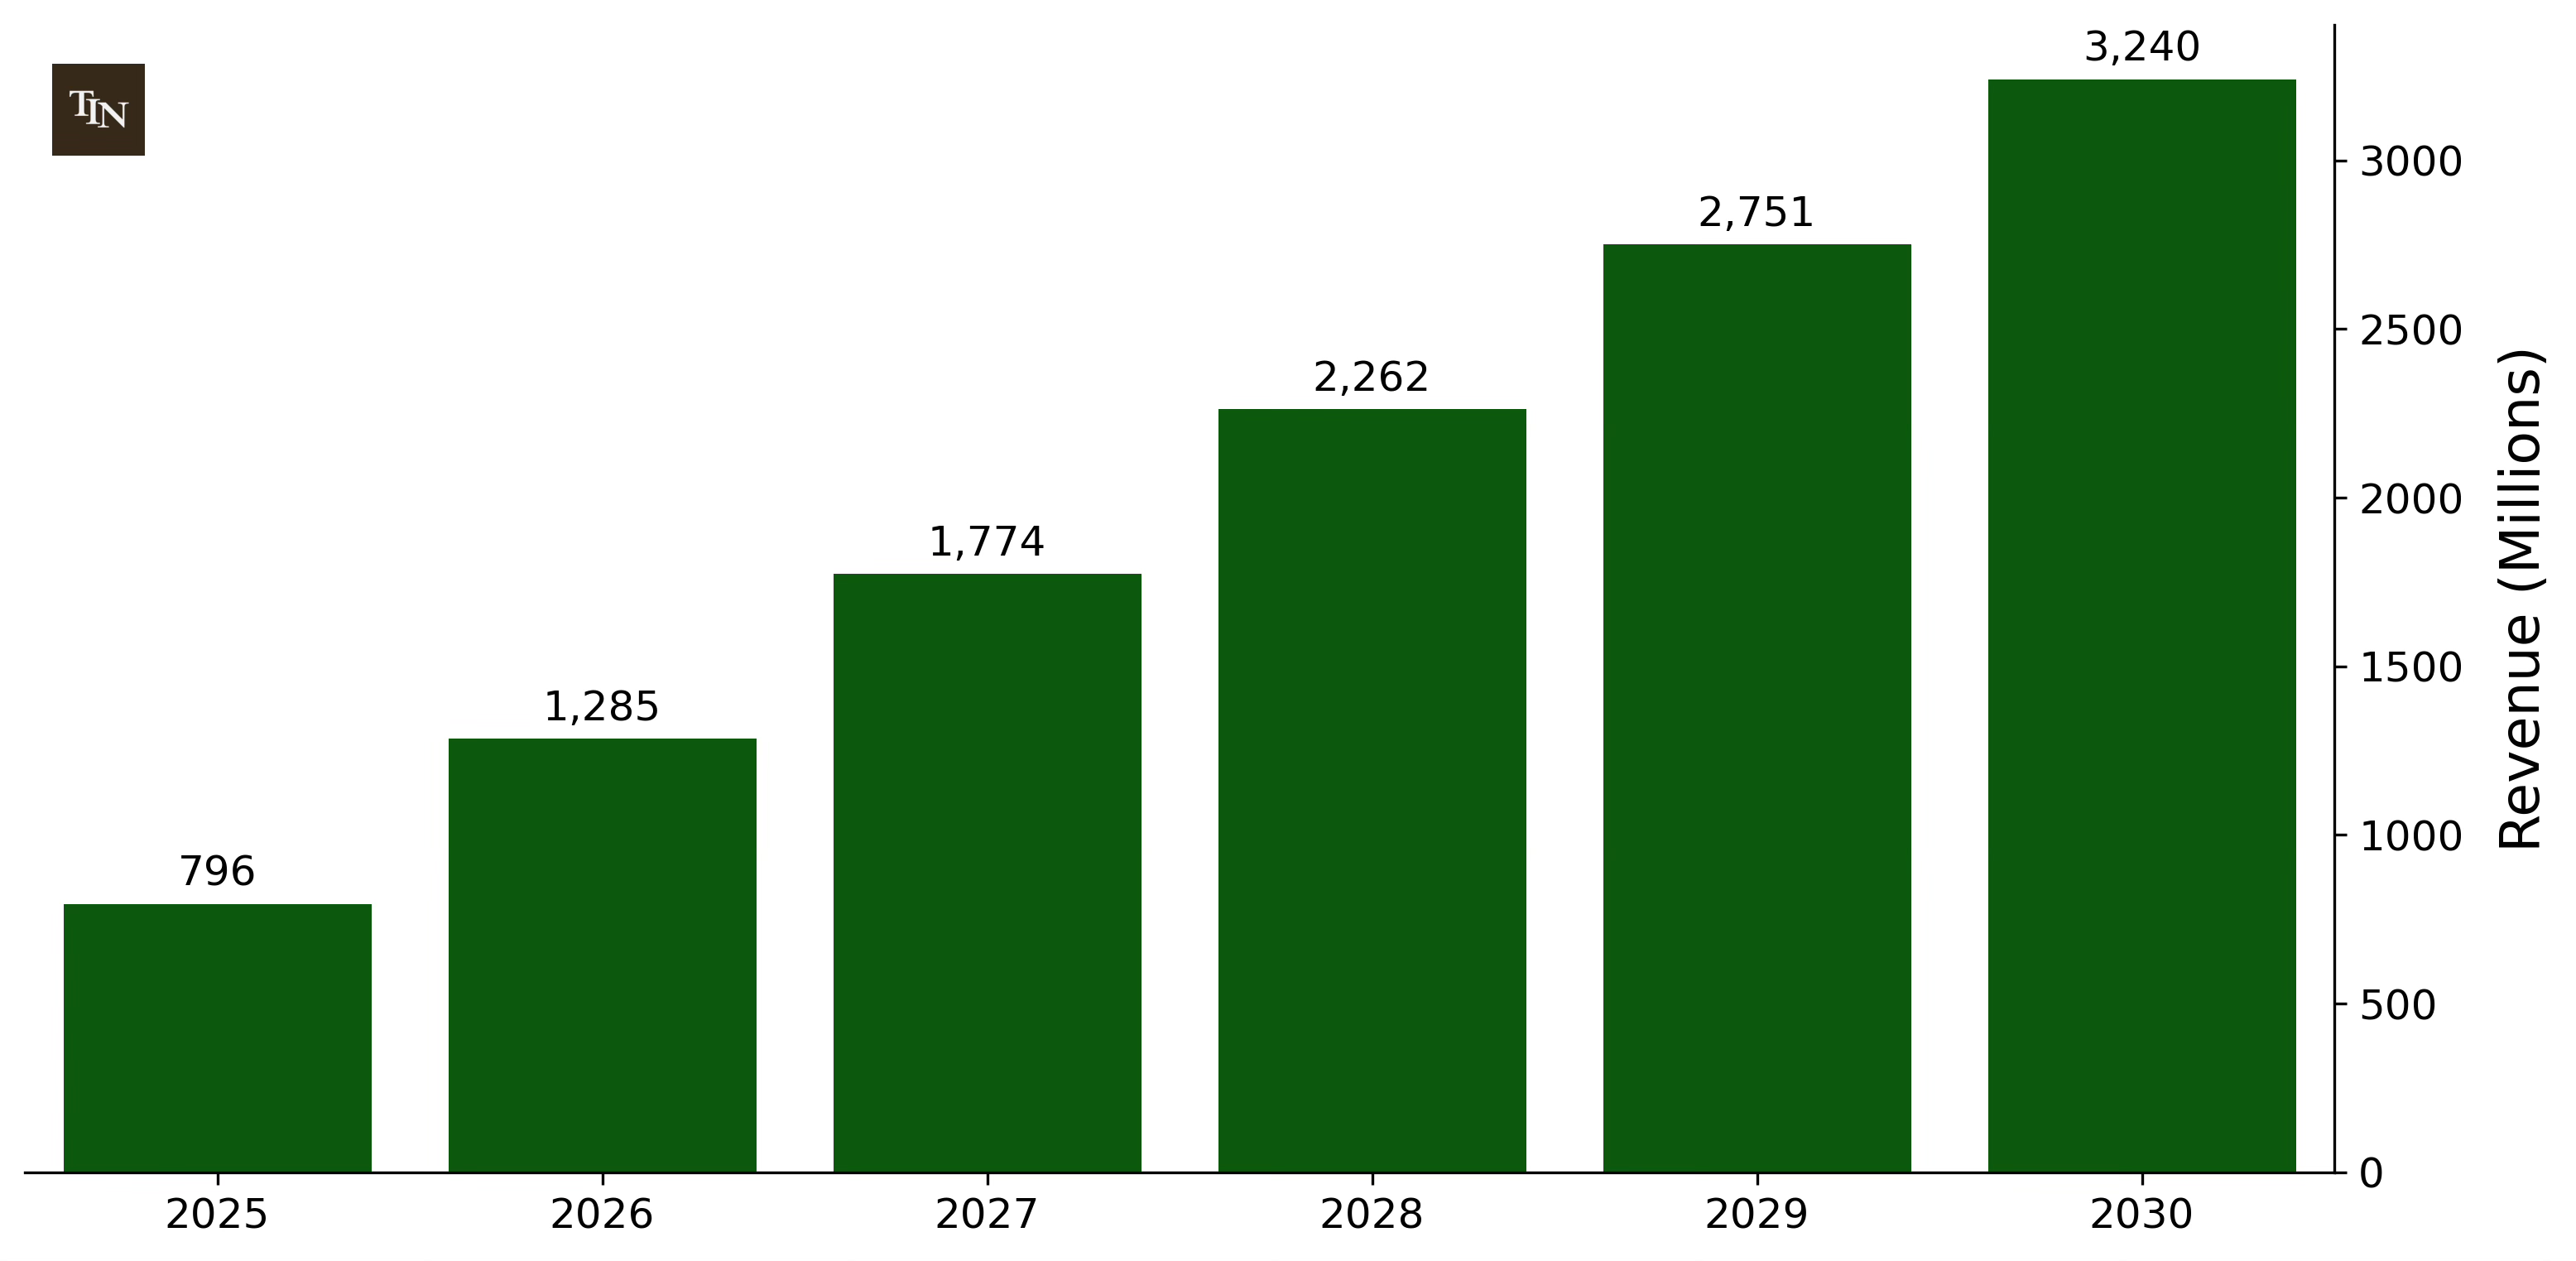
The autonomous delivery robots market exhibits explosive growth from a small base. MarketsandMarkets projects global market will reach $3.24B by 2030 from $796M in 2025, representing 32.4% CAGR. Primary drivers include e-commerce expansion (B2B commerce growing 14.5% CAGR globally), labor cost inflation (last-mile labor represents 53% of total shipping costs, with robots offering 75% reduction in labor component), urbanization (over 4 billion people in dense delivery corridors suitable for autonomous robots), and sustainability mandates providing regulatory advantages for electric sidewalk robots.
2. Competitive Intensity
The robot delivery market exhibits high competitive intensity with fragmented early-stage structure consolidating toward few actors. Serve currently lacks meaningful pricing power to offer competitive delivery costs versus human couriers. Starship Technologies leads global deployment, followed by Serve, with Nuro pivoting away and Kiwibot focusing on campus markets. Starship, Nuro, and Serve collectively controlled approximately 18% of global fleet deployments in 2024.
3. Barriers to Entry
Serve raised $187M over 18 months to deploy 2,000 robots, implying roughly $90,000-95,000 per robot fully loaded. Declining component costs, maturing manufacturing partnerships, and improving battery technology lower barriers over time. Regulatory barriers require city-by-city permit approvals (typically 3-6 months), though precedent-setting approvals by early movers reduce friction for followers.
4. Substitute Threats
Traditional gig-economy couriers remain highly competitive in lower-density areas where robot utilization cannot operate. Aerial drones (Wing Aviation, Amazon Prime Air) address suburban/rural deliveries where sidewalk robots cannot reach. On-road autonomous vehicles could eventually overtake sidewalk delivery into broader autonomous mobility solutions. The unmanned delivery market is splitting between urban deliveries where sidewalk robots dominate, and suburban/rural areas where human couriers or drones prove more viable.
Industry Dynamics Score: 7/10
Competitive Positioning
Serve positions as the #2 player in U.S. sidewalk delivery robots by fleet size, trailing Starship Technologies significantly but ahead of smaller competitors. The company’s 2025 momentum was operationally strong: 20x fleet growth, seven-market expansion, 78% sequential delivery volume growth (Q1 to Q2), merchant partnerships expanding from 1,500 to 2,500+, and maintained 99.8% completion rate during rapid scaling.
However, strategic positioning deteriorates as Starship’s November 2025 Uber partnership announcement shifts competitive dynamics unfavorably. Starship’s scale advantage widens (9M deliveries versus 100K represents 90x gap), and operating losses increased to $37.65M in Q2 2025 from $16.27M in Q2 2024 despite revenue growth. Momentum accelerates operationally but faces increased competitive pressure, risking secondary provider status within Uber’s multi-vendor ecosystem.
Competitive Positioning Score: 5/10
Business Quality
Capital Efficiency
Traditional return metrics are effectively meaningless for Serve being a pre-revenue company burning significant cash to deploy its fleet. Current ROIC sits at -31.10%, and ROE at -47.18%. The company generated -$80.21M net income on $1.94M TTM revenue, with free cash flow (FCF) of -$82.55M. These returns reflect the growth-investment phase prioritizing fleet deployment over near-term profitability, destroying substantial value at current scale with returns far below cost of capital.
Quarterly cash burn approximates $35M, with $211M cash providing runway through late 2026. Management targets breakeven at full 2,000-robot utilization with $60-80M ARR anticipated in 2026.
Capital allocation demonstrates strategic M&A focus:
Vebu - November 2024, all-stock, bringing Autocado kitchen automation and Chipotle relationship.
Vayu Robotics - August 2025, 1.7M shares plus earnouts, targeting $1 per delivery operating cost.
Phantom Auto - September 2025, undisclosed consideration, enabling 99.8% completion rate).
These acquisitions emphasize technology differentiation and unit economics improvement, though using stock during 68% dilution period raises value concerns. Vebu represents optionality on $1-2B+ kitchen automation TAM but currently lacks material revenue contribution.
R&D spending exceeded $9.1M quarterly (over 1,000% of revenue), focused on autonomy software, AI foundation models, and next-generation platforms. Gen 3 robots achieve 65% manufacturing cost reduction, 2x speed/range, and 5x AI computing power versus Gen 2. However, commercial viability remains unproven until utilization demonstrates revenue per robot approaching $30-40K annually versus current $3,000-3,700.
Capital Efficiency Score: 3/10
Profitability & Margins
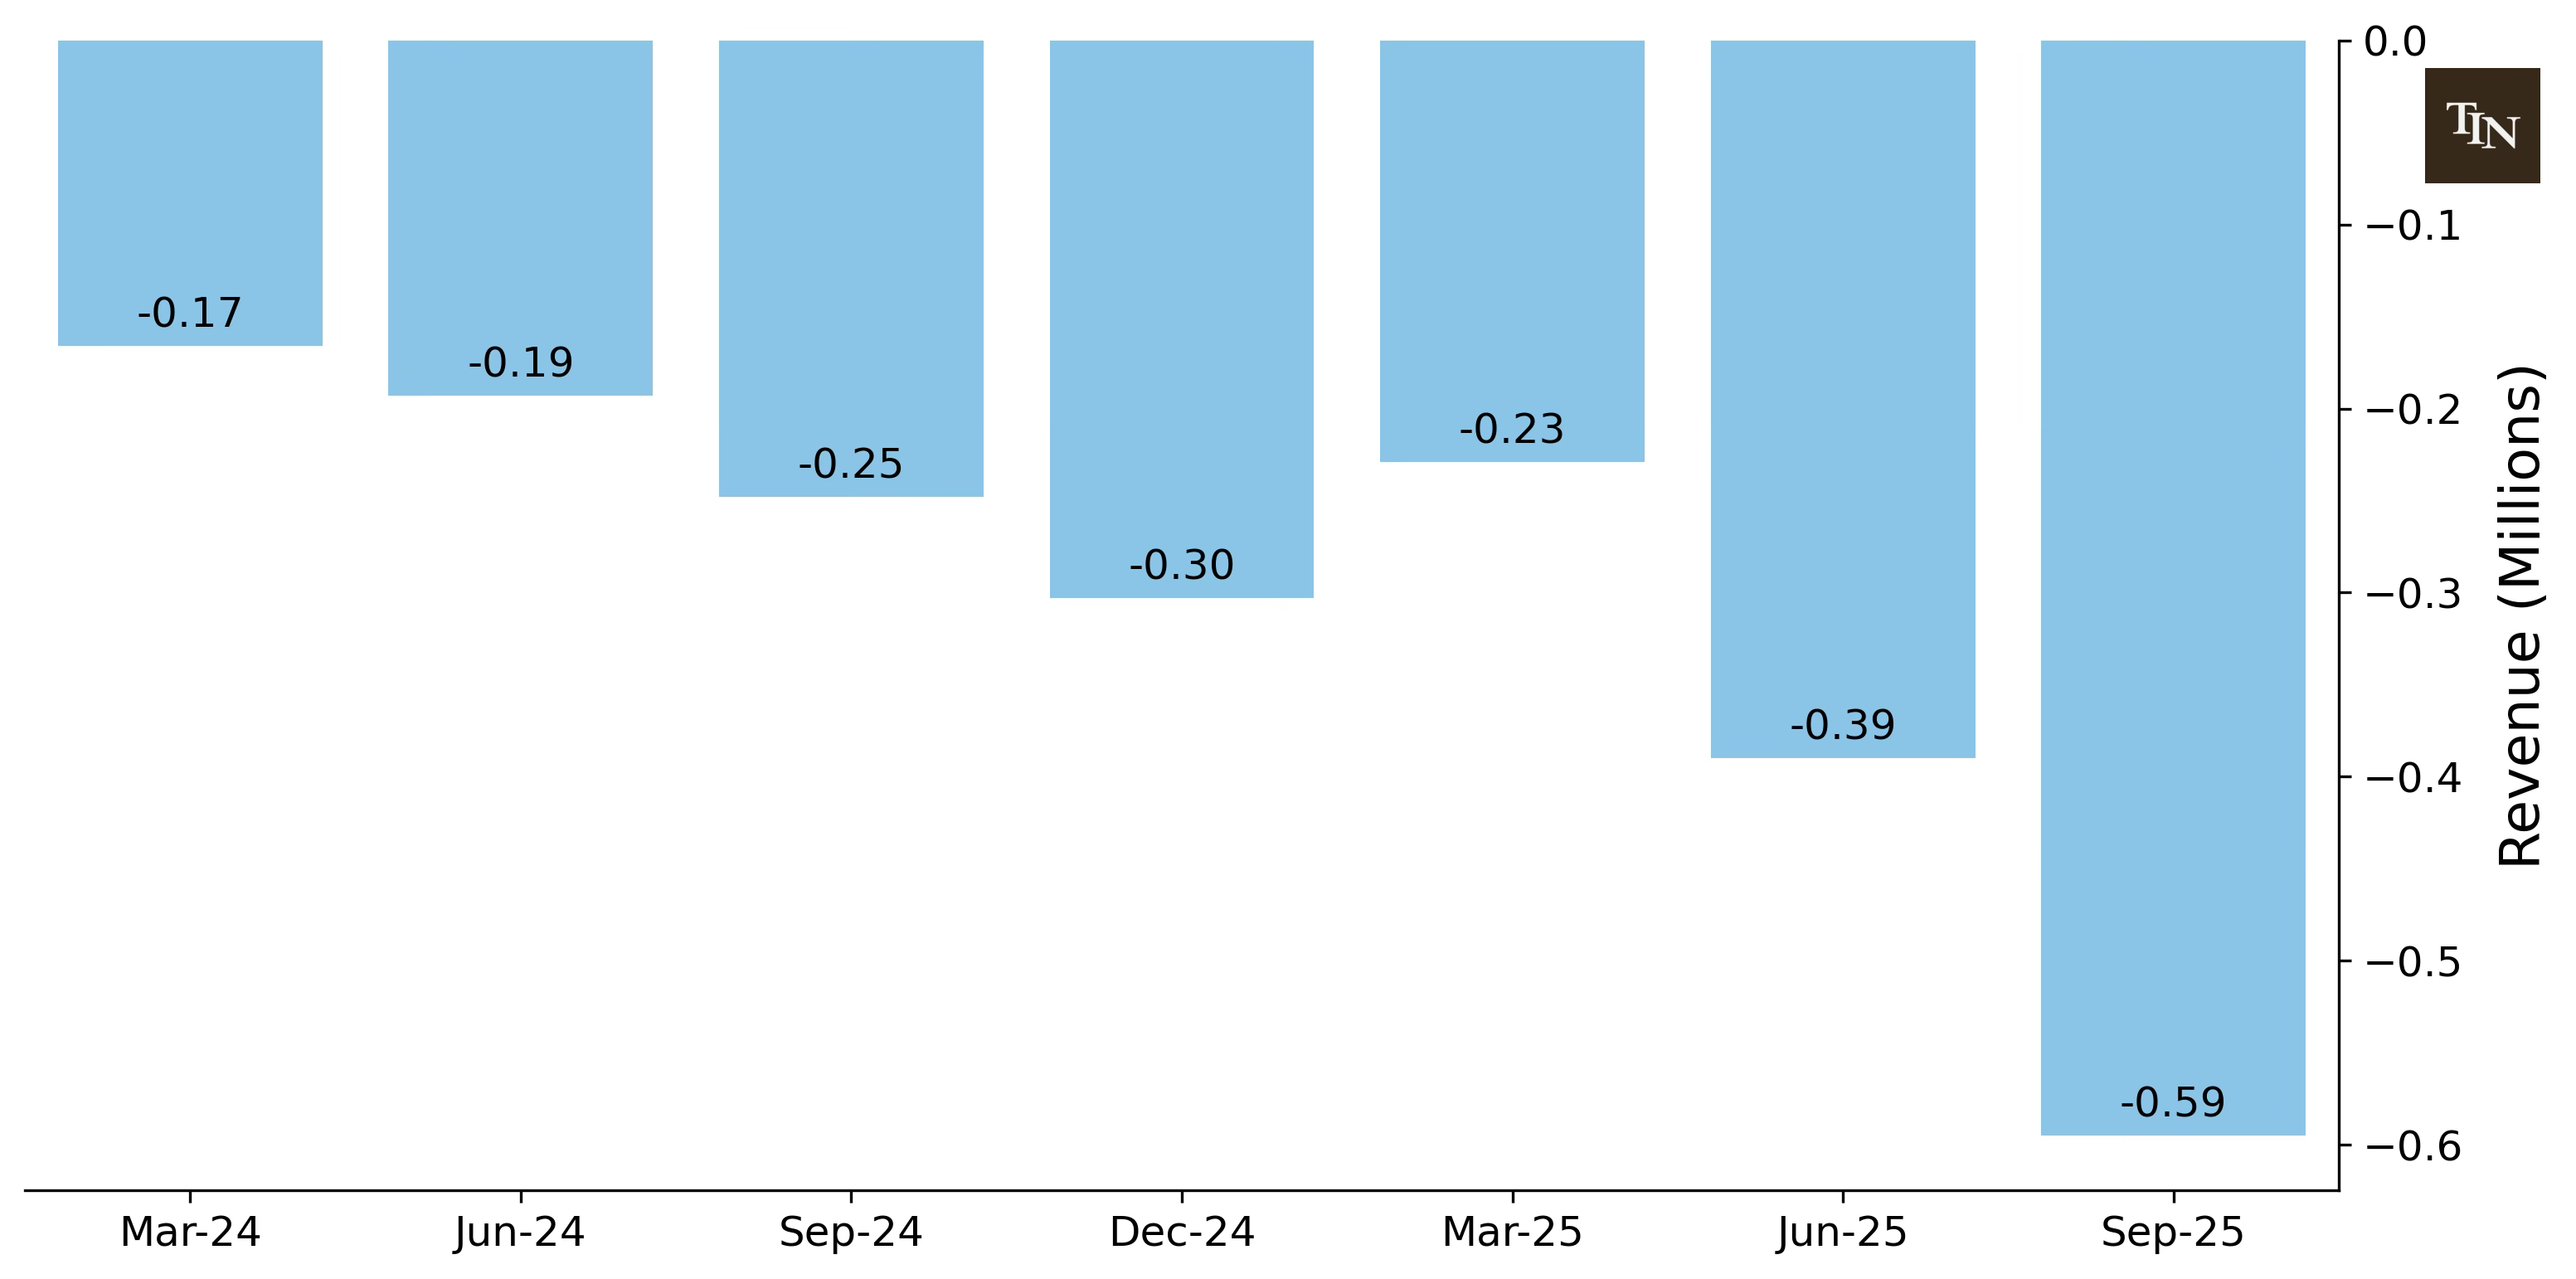
Serve Robotics currently loses money at every level. Q2 2025 gross margin was -674% (gross loss of $4.33M on revenue of $642K), representing severe deterioration from Q2 2024 positive 252% gross margin. This reversal during revenue growth indicates deliveries lose money at unit level before operating expenses. Operating margin Q3 2025 was -4,423%, with net margin of -4,122%. TTM net margin is -3,729%.
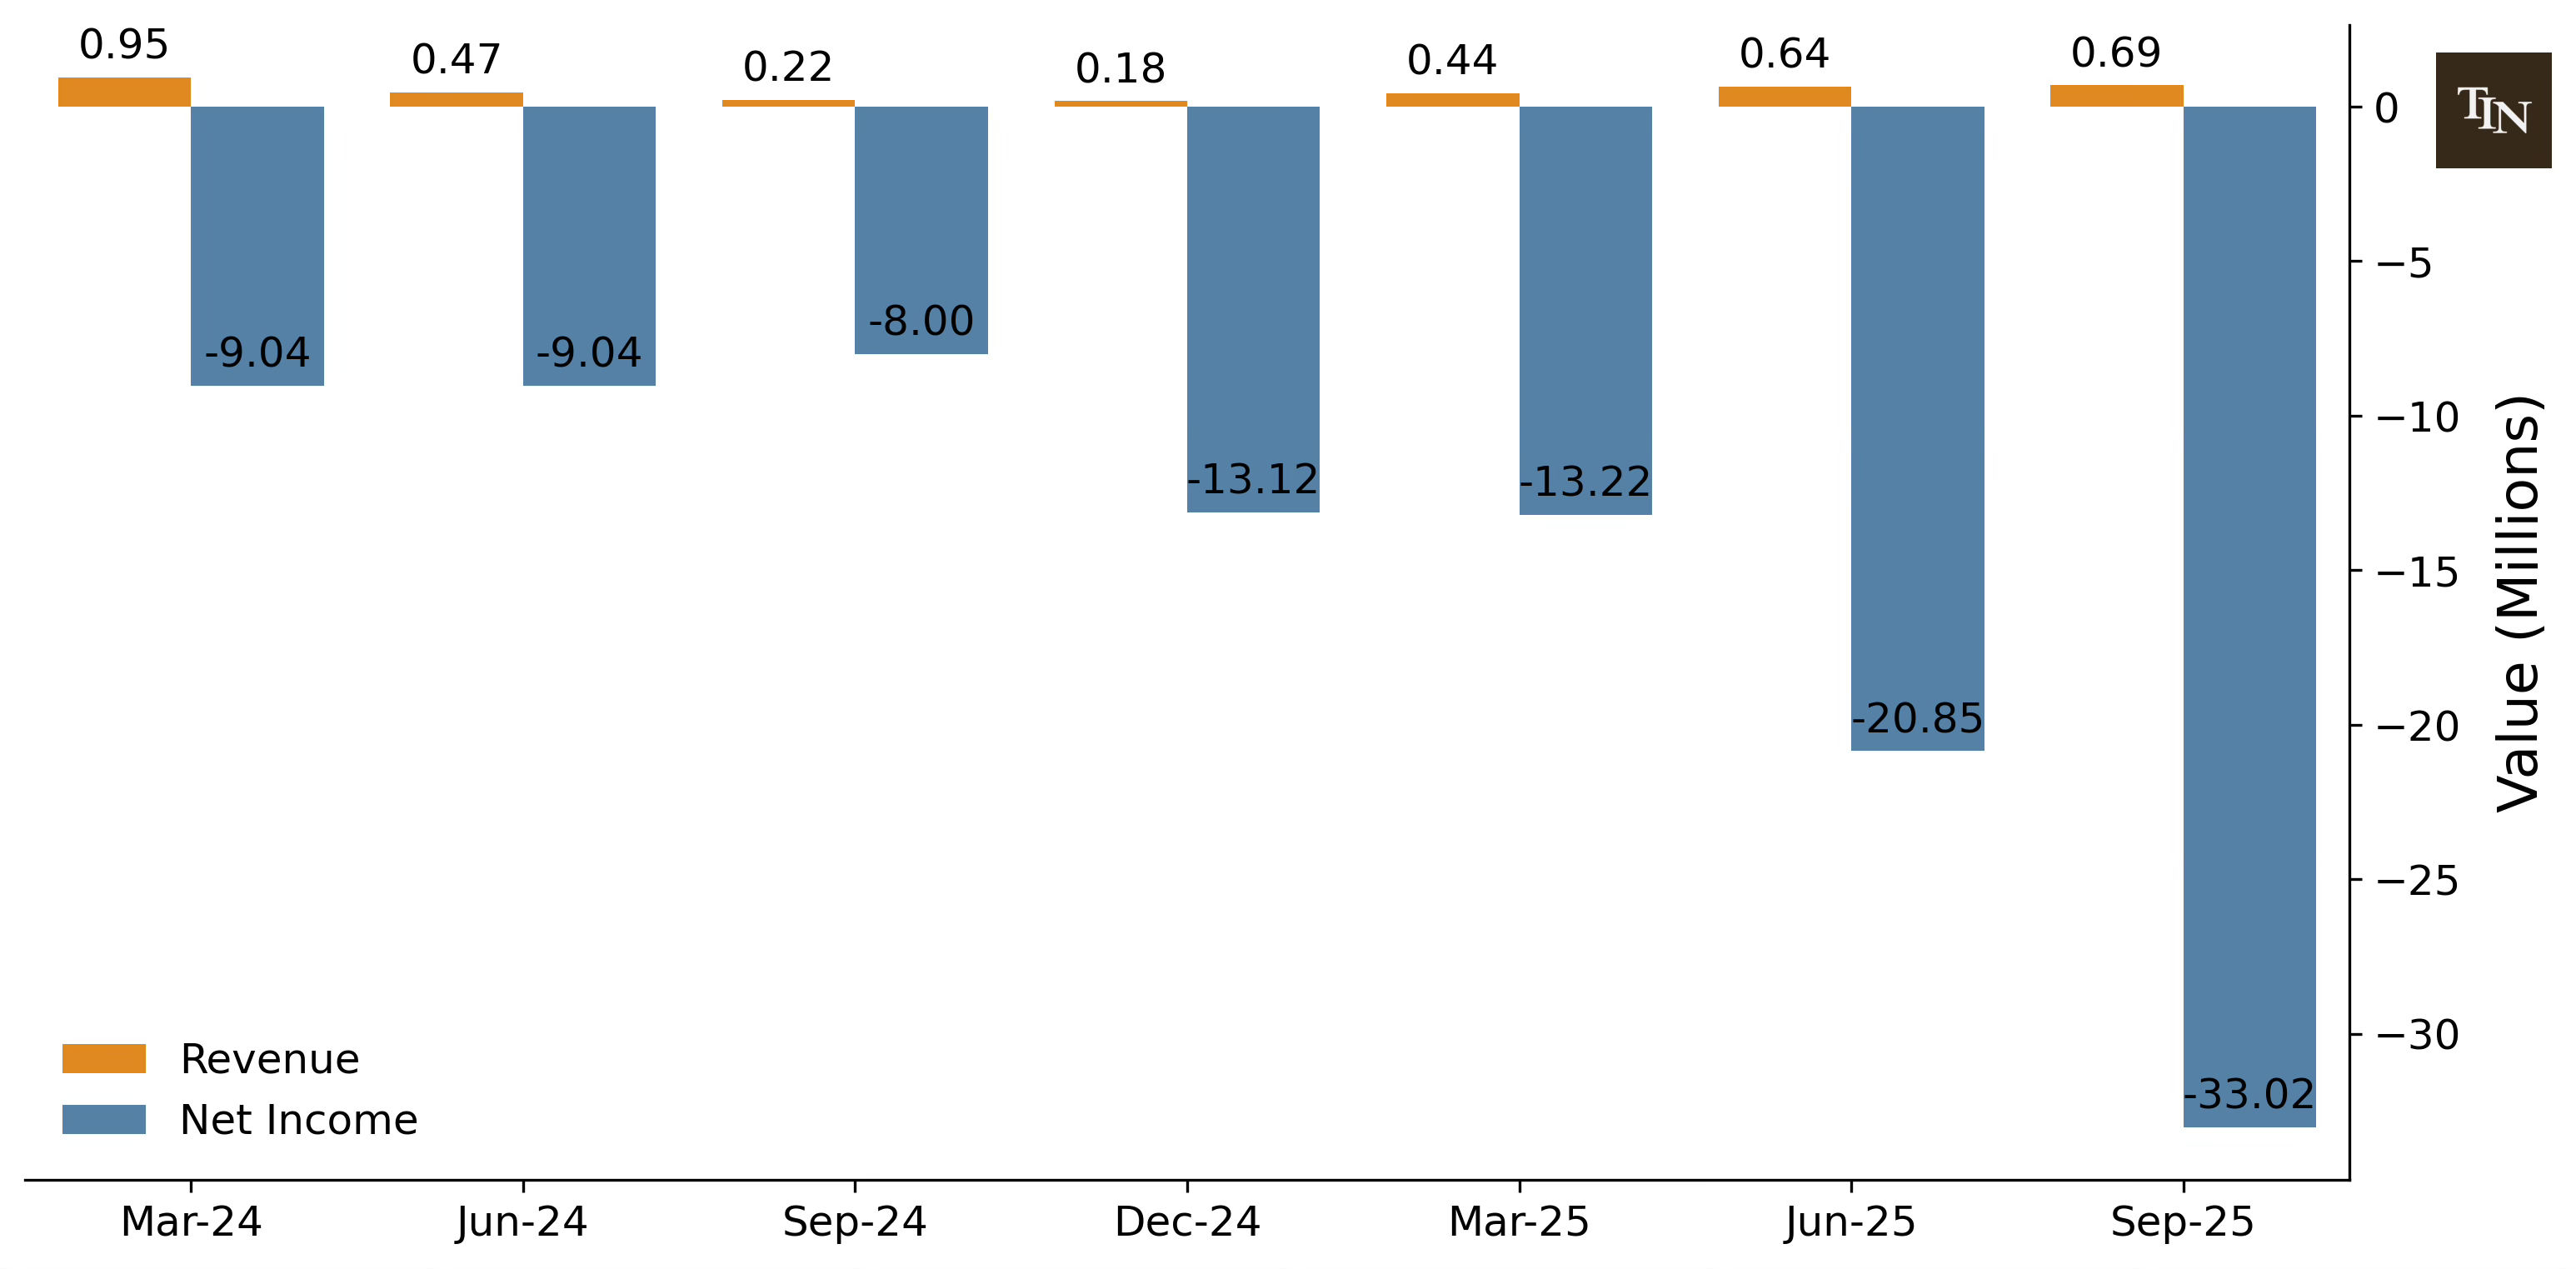
The trajectory shows expanding losses faster than revenue growth. Q2 2024 to Q2 2025 revenue increased 119% while operating expenses increased 170%, with no evidence of incremental revenue flowing to bottom line. Management targets breakeven at full 2,000-robot utilization with $60-80M run rate, requiring estimated 15-20 deliveries per robot per day (current utilization undisclosed). Analyst consensus projects $3.6M revenue (FY 2025) and $28M revenue (2026E), implying profitability remains 2-3 years away.
The company burned $80M+ trailing on $1.94M revenue, with gross margin deterioration during scaling period and lack of disclosed delivery economics to validate profitability. Management targets seem highly unrealistic at this stage. Starship raised $90M+ over 10 years before reaching profitability scale, while Serve has raised $187M in 18 months and remains far from breakeven.
Execution track record shows limited quarterly guidance history. Q3 2025 revenue guidance was $540K-630K with actual $687K (beat), though the guidance bar seems intentionally set very low.
Profitability & Margins Score: 4/10
Revenue & Cash Quality
Revenue structure is approximately 90-95% recurring (delivery-as-a-service fees from Uber and DoorDash charged per completed delivery) and 5-10% transactional (branding/advertising on robots, software licensing). High recurring percentage provides predictability, though contingent on maintaining platform partnerships.
Customer concentration represents severe risk. Uber Eats and Magna International account for 31% and 39% of Q2 2025 revenue respectively, a 70% concentration in top two customers alone. DoorDash partnership announced Q3 2025 provides diversification pathway but remains early-stage with minimal revenue contribution. Revenue segments split between Software services primarily from Magna licensing ($312K Q2 2025) and Fleet services from delivery fees and branding ($330K Q2 2025).
FCF is deeply negative and deteriorating. Trailing operating cash flow of -$56.86M and CapEx of -$25M produce FCF of around -$82M. The company consumes approximately $60M+ cash annually with no path to positive cash flow until revenue inflects materially above $60M. Cash runway sits at approximately 2.55 years, though management guidance implies burn may accelerate in 2026 to drive utilization improvements. The October 2025 $100M capital raise extended runway but diluted shareholders 15-20%.
Revenue & Cash Quality Score: 4/10
Growth & Risk
Market Opportunity
The autonomous delivery robots market is valued at $796 million in 2025, projected to reach $3.24 billion by 2030 (32.4% CAGR per MarketsandMarkets November 2025). Serve’s addressable market concentrates on sidewalk robots for food delivery and retail in North American urban markets, representing approximately $400-500M (50-60% of total TAM given geographic and segment constraints).
At TTM revenue of $1.94M, Serve holds only 0.25% market penetration, indicating early-stage positioning. At full 2,000-robot utilization generating projected $60-80M run rate, Serve would command 7.5-10% of 2025 TAM. Geographic expansion covers seven metros reaching 3+ million people, with each new city representing roughly $5-10M annualized potential at maturity. The five market launches in 2025 demonstrate executable playbook despite city-by-city permit requirements.
DoorDash partnership provides access to 37M monthly users (comparable to Uber Eats’ 39M), diversifying platform dependency and potentially doubling addressable order volume. Partnership with national restaurant chains (Shake Shack, Little Caesars, 7-Eleven, Jersey Mike’s) targets chains with 1,000+ locations for standardized deployment. Chipotle relationship via Vebu acquisition (3,500+ locations) provides optionality on kitchen automation (Autocado) and delivery robot deployment, representing incremental $1-2B+ TAM.
Market Opportunity Score: 8/10
Risk Assessment
1. Customer Concentration
Uber partnership is contractual through 2025 but non-exclusive, with Uber maintaining concurrent partnerships with Starship, Cartken, and Motional. If Uber terminates partnership, Serve would lose around $800K annual revenue. If Magna exits manufacturing agreement, 6-12 month production disruption delays $15-25M robot output. Combined, these events would shrink revenue around 70%, requiring emergency capital raise with significant dilution. DoorDash partnership provides diversification but remains early-stage.
2. Unit Economics / Profitability Path
The company has never achieved positive gross margin at scale. If utilization plateaus at 10 deliveries daily versus target of 15-20, revenue per robot would fall to $20-25K annually (versus $30-40K target), creating 25-40% shortfall versus management’s run rate guidance. If breakeven pushed to 2028-2029, cumulative burn would reach $250-300M additional beyond current cash, requiring multiple raises with total dilution potentially reaching 100-150%.
3. Competitive Displacement
Starship Technologies leads with 9+ million deliveries completed versus Serve’s 100K, operating 2,700+ robots across 270+ locations. Starship raised $50M to expand to 12,000 robots by 2027 and announced global Uber Eats partnership entering U.S. 2027. If Starship captures 50%+ urban delivery market, Serve’s addressable market reduces from $400-500M to $200-250M, limiting upside to $30-40M run rate versus $60-80M target. If Uber chooses Starship as primary partner post-2025, Serve loses its largest customer.
4. Regulatory/Permit Risk
Sidewalk robots require city-by-city permits with varying regulations. If 30-40% of target metros impose restrictive caps, 600-800 robots cannot be utilized, creating $18-32M revenue shortfall. If human safety operators are required per regulation, operating costs increase significantly.
5. Technology/Safety Incident
As fleet scales to 2,000 robots, incident probability increases. If serious injury occurs, potential lawsuit damage could significantly degrade revenue. If federal regulatory response imposed nationwide pauses for investigations, reputational damage would reduce demand.
Risk Assessment Score: 4/10
Valuation Context
Serve Robotics trades at extreme multiples reflecting growth expectations disconnected from current fundamentals. Stock price of $14.42 represents market capitalization of approximately $1.07B (based on ~74.4M shares), with enterprise value of $867M (market cap less net cash of $206M). The company is essentially debt-free with minimal debt of $4.15M.
Trailing revenue of $1.94M produces EV/Sales ratio of 443. This extreme premium reflects hypergrowth profile (773% revenue growth in 2024), TAM expansion at 32.4% CAGR, strategic partnerships with Uber/DoorDash/Magna/Nvidia endorsement, technology differentiation via Vayu AI and Level 4 autonomy, and early-stage pure-play status. However, premium is NOT justified by massive negative gross margins, unproven unit economics, competitive disadvantage versus Starship’s 90x delivery advantage, and high execution risk from customer concentration.
If the company achieves 2026 consensus revenue of $26M, forward P/S would drop to 23x, comparable to high-growth pre-profitable SaaS companies. This requires 8x revenue increase, aggressive but possible if 2,000-robot fleet reaches target utilization. If utilization reaches $60-80M run rate, implied P/S would be 8-11x at current valuation, suggesting current valuation anticipates successful execution. However, if unit economics fail, continued cash burn requires dilutive capital raises with multiple compression likely to 5-10x forward revenue, implying 50-70% downside.
Analyst consensus price target of $18.8 (median) implies +36% upside from current price, with range from $15 to $26.
Valuation Context Score: 5/10
INVESTMENT THESIS SYNTHESIS
Key Strengths
1. Massive TAM with Favorable Unit Economics Trajectory
Serve operates in a $796 million market expanding to $3.24 billion by 2030 at 32.4% CAGR, with current 0.25% penetration representing early-stage positioning with substantial runway. Secular drivers are structural: e-commerce growth, labor cost inflation, and urbanization creating dense delivery corridors. Platform partnerships with Uber Eats and DoorDash provide distribution accessing combined 76 million monthly users without consumer acquisition costs. Gen 3 robots demonstrate 65% manufacturing cost reduction versus Gen 2 while delivering double the speed/range and 5x AI computing power. Vayu AI acquisition targets $1 per delivery operating cost, potentially enabling 20-30 percentage point gross margin improvement if achieved. At $60-80M run rate from full utilization, Serve would command 7.5-10% of 2025 TAM with pathway to $200M+ revenue over 3-5 years as market expands and company scales to 5,000-10,000 robots.
2. Operational Execution Demonstrated at Scale
The company successfully deployed 2,000 robots on schedule by December 2025 (up from <100 robots early 2025), representing 20x fleet expansion validating manufacturing partnership with Magna International. Geographic expansion from 2 to 7+ metros in 2025 demonstrates replicable playbook for market entry and regulatory management. The 99.8% delivery completion rate through rapid scaling proves Level 4 autonomy capability and operational reliability. Sequential delivery volume growth of 78% (Q1 to Q2 2025) and merchant partnerships expanding from 1,500 to 2,500+ demonstrate demand exists when capacity is available. Strategic partnerships announced in 2025 (DoorDash multi-year, Magna manufacturing, Vayu AI) position company for 2026 utilization ramp, with dual-platform presence reducing customer concentration risk.
Key Concerns
1. Unproven Unit Economics with Deteriorating Margins
Gross margin collapsed from 252% in Q2 2024 to -674% in Q2 2025 during revenue growth period, demonstrating business model is not self-funding. Revenue per robot runs just $3,000-3,700 annually versus management’s $30-40K target, implying utilization must increase 8-11x to reach profitability. Management’s path requires 15-20 deliveries per robot daily at $60-80M run rate, but company has not disclosed current utilization rates, cost per delivery, or delivery fee structure to validate math. Operating losses increased $21.4M year-over-year despite revenue increase of just $349K, demonstrating anti-leverage where costs scale faster than revenue. The 68% dilution over 18 months with more dilution likely ahead indicates market skepticism of near-term profitability.
2. Existential Competitive and Customer Concentration Threats
Starship Technologies completed 9+ million deliveries (90x advantage), operates 2,700+ robots across seven countries, claims positive gross margins approaching profitability, and announced global Uber Eats partnership entering U.S. 2027. This directly threatens Serve’s positioning as Uber’s exclusive U.S. partner and validates platform multi-vendor strategy commoditizing robot delivery services. Uber and Magna represent 70% of Q2 2025 revenue, creating existential dependency where loss of either customer would crater revenue and force emergency capital raise. DoorDash partnership provides diversification but remains early-stage with minimal contribution. Serve lacks meaningful moat or differentiation beyond execution speed, with no proprietary technology, superior AI training data, or exclusive platform relationships.
Bull Case

Bull Scenario 1: Unit Economics Inflection Powers Operating Leverage
During 2026, Serve achieves target utilization through DoorDash partnership ramp increasing order volume, merchant density expansion enabling more deliveries per hour, and Vayu AI delivering promised cost improvements. The combination produces $60-80M annualized run rate at gross margins approaching positive territory. Operating leverage inflects as revenue scales while operating expenses grow moderately, with fixed cost base leveraging rapidly. The company achieves EBITDA breakeven by late 2026 and demonstrates path to GAAP profitability in 2027, validating business model and triggering multiple expansion typical of newly-profitable high-growth technology companies.
Bull Scenario 2: Platform Ecosystem with M&A Optionality
Serve successfully integrates Vebu’s Autocado kitchen automation into Chipotle and additional chains, creating comprehensive restaurant automation solution combining back-of-house prep with last-mile delivery. Magna software licensing expands as other manufacturers seek proven Level 4 autonomy stack. This combination positions Serve as horizontal platform for autonomous last-mile delivery (robots, software), attracting acquisition interest from Uber (vertical integration), Amazon (complement Scout program), or automotive incumbents seeking delivery-as-a-service revenue.
Bear Case
Bear Scenario 1: Unit Economics Terminal Failure Forces Distress
Through 2026, Serve struggles to improve utilization beyond 8-10 deliveries per robot daily due to market saturation in initial Los Angeles expansion and slower-than-expected DoorDash integration. Vayu AI fails to deliver promised cost improvements, with operational costs remaining elevated due to remote monitoring, insurance, and maintenance expenses. Revenue run rate reaches only $25-35M by end 2026 at continued negative gross margins. Operating losses continue at $80-100M+ annually, exhausting cash by Q3 2026 and forcing emergency capital raise. With negative unit economics demonstrated, company must raise at depressed valuation requiring significant dilution. Starship’s U.S. entry further pressures positioning.
Bear Scenario 2: Starship Displacement and Platform Commoditization
Starship’s global Uber Eats partnership launches successfully, with Uber allocating majority of incremental robot volume to Starship based on superior operational track record and positive gross margins. Uber’s multi-vendor strategy explicitly commoditizes robot delivery, forcing Serve to compete on price. To maintain volume, Serve accepts delivery fee reductions, compressing already-negative margins and eliminating profitability paths. DoorDash observes Uber’s approach and adds Starship as secondary provider, reducing Serve’s differentiation. Addressable market effectively halves as Starship captures dominant share, limiting revenue ceiling to $30-40M even with successful execution. Unable to achieve scale required for profitability, company burns remaining cash through 2027 and faces distressed sale or pivot to software licensing while exiting hardware operations.
Valuation Assessment
Making an objective estimate of future growth and company valuation for Serve Robotics is extremely challenging, because the company not only needs to prove that their business model works, but also that they will be able to scale to 2,000 robots in 2026, all doing 15-20 deliveries per day, and to continue ramping up robot production.
IF all bull scenarios materialize, and assuming:
Each of the 2,000 robots will do 20 deliveries per day (the current maximum estimated)
Assuming $2 per delivery (highly speculative)
EV/Sales shrinks to 44 (10% of current 443 levels)
I think there is a possibility that stock price may range $20-21, a CAGR of 18-20%. Then, if number of robots doubles in 2027, with EV/Sales shrinking to 40, a path to $34-36, or CAGR of 54-58% from current stock price does not seem unreasonable.
IF all bear scenarios materialize, and assuming:
Each of the 2,000 robots will do 8 deliveries per day
Assuming $2 per delivery
EV/Sales shrinks to 40 in 2026
I think current stock price shows a highly overvalued company, where fair price would be around $9, a CAGR of -21%. Then, if number of robots in 2027 only increases by 50% to 3,000, fair price would be $11-12, a CAGR of -12%.
Valuation Assessment: 4/10
SCORING SUMMARY
Competitive Position: 16/30
Business Quality: 11/30
Growth & Risks: 17/30
Valuation Assessment: 4/10
Total Score: 48/100
Score Interpretation:
80-100: Strong Buy - High-quality business at attractive valuation
70-79: Buy - Good business at reasonable valuation
60-69: Hold / Small Position - Decent business, full valuation or execution concerns
Below 60: Pass - Fundamental concerns or valuation disconnect
OVERALL ASSESSMENT
I scored Serve Robotics 48/100 to reflect my personal (significant) concerns across competitive positioning (weak moat, intense competition from better-resourced Starship Technologies), business quality (catastrophic margins, unproven unit economics, severe cash burn), and growth/risk balance (strong TAM offset by high execution risk and customer concentration).
The directional trajectory diverges sharply between operations and finances. Operationally, the company successfully executed 2025 fleet deployment targets with 2,000 robots delivered on schedule, seven market launches completed, and 99.8% delivery completion rate maintained, demonstrating competence and replicable market entry playbook. However, financial metrics massively deteriorated during this scaling period: gross margins collapsed from positive 252% to -674%, operating losses increased from $16.3M to $37.7M quarterly, and share dilution reached 68% over 18 months. In my view, this is a high-risk, high-potential-return speculation rather than a quality compounder, with strong secular TAM growth and proven technology capabilities offset by unvalidated profitability path and intense competitive threats.
The core trade-off is massive TAM expansion (32.4% CAGR, $796M to $3.24B by 2030) and early-stage positioning (0.23% current penetration) with operational execution demonstrated at scale (2,000 robots deployed, 99.8% completion rate) versus unproven unit economics destroying $60M+ cash annually, existential competitive threat from Starship Technologies (90x delivery advantage and global Uber partnership threatening exclusive positioning), and severe customer concentration (70% revenue from Uber and Magna). However, I personally see the risk as terminal. Negative gross margins indicate deliveries lose money before operating expenses, management has not disclosed utilization rates or delivery costs to validate profitability math, and 68% dilution with more likely ahead signals market skepticism.
This opportunity suits aggressive growth investors with high risk tolerance willing to accept 60-80% downside risk for 100-250% upside potential contingent on flawless execution of an unvalidated business model. I think an appropriate position sizing is <1% of portfolio maximum given binary outcome distribution (either unit economics inflect driving massive upside, or terminal failure forces distressed exit). This stock is definitely not suitable for investors requiring near-term profitability, established business models, or capital preservation.
The thesis would strengthen with positive gross margins emerging during 2026, disclosure of current utilization rates and delivery economics, or successful DoorDash partnership ramp demonstrating dual-platform reduces concentration and increases utilization. The thesis would weaken if Q1-Q2 2026 results show continued margin deterioration despite revenue growth, Uber awards majority of incremental volume to Starship following U.S. entry (2027), or company requires additional capital raise before demonstrating path to breakeven, indicating unit economics are terminal rather than timing-related.
Disclaimer
This newsletter is for educational and informational purposes only. Nothing I write constitutes financial advice, investment recommendations, or a solicitation to buy or sell any securities. You should not make investment decisions based solely on my analysis. Always do your own due diligence, consult with qualified financial advisors, and consider your individual circumstances before making any investment. All analysis and opinions are my own and can be wrong. Markets are uncertain, and even well-researched ideas can lose money. I am not a licensed financial advisor and accept no liability for any losses resulting from the use of information in this newsletter.